![305073553_499374155352633_936760715116756730_n.png]](https://knowledge.neuronsinc.com/hs-fs/hubfs/305073553_499374155352633_936760715116756730_n.png?height=24&name=305073553_499374155352633_936760715116756730_n.png)
Digital advertising
Any digital advertising
Digital advertising covers ads distributed through digital channels and platforms to reach a target audience. Because impact varies a lot by format and channel, we recommend comparing against the benchmark that matches your ad's specific use case, like display ads or social media ads.
Use this overall category when you want to compare against the average impact across any type of digital advertising.
If a benchmark comparison on an existing asset looks different than it used to, the underlying benchmark data was likely updated. Update the asset to see its current Neurons Impact Score and comparison. Learn more.
Display ads
 Display ads are embedded in a website or other digital platform, appearing overlaid on content or alongside it. Because they need to work across many different web environments, this is one of the most diverse categories in format and size.
Image display ads are benchmarked against banner ads shown outside of any website context, like the example.
Video display ads may be skippable, interactive or include call-to-action overlays.
Social media is a leading channel for advertisers of every size. Because most people view these ads on mobile, screen space and design efficiency are critical to performance.
 Image social media ads: Impact varies by platform, since people use each one differently. We recommend comparing against the platform-specific benchmark whenever possible, currently available for Facebook, Instagram, and LinkedIn. Use this overall category to compare across all platforms instead. These benchmarks test the creative itself, with no surrounding post elements included.
Video social media ads: Social media video spans square, landscape, and vertical formats, each suited to a platform's aspect ratio and user behavior. Our benchmark ranges only include creatives within each platform's allowed aspect ratio, keeping the sample representative.
We recommend comparing against the platform-specific benchmark, currently available for Facebook, Instagram, LinkedIn, TikTok, and YouTube. Use this overall category to compare across all platforms instead.
The Neurons Impact Score takes into account the platform's call-to-action, like the button beneath a Facebook, Instagram, or LinkedIn post, or the CTA overlay on a TikTok or YouTube video ad. So if there is no CTA on the creative you upload, it's excluded from both the benchmark and the scoring for these platforms.
Facebook users are focused on social dynamics more than any single element on the page, so a clear, effective creative, copy, and CTA are what drive an ad's performance.

Image Facebook ads: Any standard sponsored image ad in the main Facebook feed. This benchmark tests the creative on its own, and includes horizontal (1.91:1 or 16:9), square (1:1), and vertical (4:5) creatives, representing the mix of image ads actually running on Facebook.
Video Facebook ads: Any standard sponsored video ad in the main Facebook feed.
This range spans videos from 3 seconds to 1 minute, in horizontal (1.91:1, 16:9), vertical (4:5), and square (1:1).
Because this benchmark tests the creative alone, it also works for ads in Facebook Marketplace, Stories, Live, and Messenger, which share comparable aspect ratios.
Because the benchmark dataset for this category only includes creatives out of context, it can also be used for ads appearing in Facebook Marketplace, Facebook Stories, Facebook Live and Messenger, as they have comparable aspect ratios.
Instagram's primary use case is browsing photos and images, which makes the creative and layout the most important part of the ad.

Image Instagram ads: Any standard sponsored image ad in the main Instagram feed.
This benchmark tests the creative on its own, and includes vertical (4:5, 9:16) and square (1:1) creatives, representing the mix of image ads on Instagram.
Video Instagram ads: Any standard sponsored video ad in the main Instagram feed, excluding influencer or paid partnership content. This range mainly spans 3 to 30 second videos, in vertical (4:5, 9:16) and square (1:1).
While not explicitly collected for this purpose, this range can also be used to gauge Instagram Reels or Stories.
LinkedIn ads
LinkedIn users are in a professional mindset, which means clarity, credibility, and relevance tend to carry more weight than they do on consumer-first platforms.
 Image LinkedIn ads: Any standard sponsored image ad in the main LinkedIn feed. This benchmark tests the creative on its own.
Video LinkedIn ads: Any standard sponsored video ad in the main LinkedIn feed. As with all social platforms, this benchmark tests the creative alone.
Mixed media LinkedIn ads aren't available as a benchmark category yet.
Dailymotion ads
Only available for videos
Dailymotion focuses on highly curated viewing experience and first-rate videos which resonate with viewers. Dailymotion advertising emphasizes brand safety, transparency and relevancy to the target audience to maximise viewability and completion. This benchmark category should be used to benchmark against recommended scores for this digital channel.
This category covers pre-roll, mid-roll, and post-roll video ads ranging from 6 seconds to 2 minutes and have a standard landscape (16:9) format.
TikTok ads
Only available for videos
TikTok's short-form video format has made it a major force in attention, brand awareness, and conversion. Catching attention in the first two seconds is critical for organic content and ads alike.
This category covers standard sponsored video ads in the main For You feed, excluding influencer or paid partnership content. The dataset includes videos from 3 to 30 seconds, exclusively in vertical format (9:16) to reflect typical TikTok content.
While not explicitly collected for this purpose, this range can also be used to gauge TikTok Stories, YouTube Shorts, and Instagram or Facebook Reels.
YouTube ads
Only available for videos
YouTube set the standard for the modern attention economy across both short- and long-form video. In pre-roll and in-feed placements, the first few seconds are what capture the audience and drive results.
This category covers standard TrueView in-stream video ads, both skippable and unskippable, as well as bumper ads. The dataset mostly includes videos from 6 seconds to 1 minute, in a standard landscape (16:9) format.
This category can also be used for optimizing ads on other long-form, in-stream video platforms, like Twitch or Facebook Gaming.
CTV ads
Only for mixed media
Connected TV (CTV) ads run on internet-connected televisions and streaming devices, pairing the reach of TV with the targeting of digital. Because these placements typically combine a video layer with an interactive or display layer, they're benchmarked as mixed media rather than as image or video alone.
Traditional advertising
Any traditional advertising
Traditional advertising covers offline channels like TV, out of home, and print. Because impact varies a lot by advertising type, we recommend comparing against the benchmark that matches your ad's specific use case, like out of home, print, or TV ads.
Use this overall category to compare against the average impact across any type of traditional advertising. For images, the “any” benchmark includes both out of home and print ads; for videos, it's based on TV assets.
Out of home ads
Only available for images
Out of home (OOH) ads take many shapes and appear across many locations: building sides, bus stops, roadside panels, malls, and vehicles.
Because OOH creative is seen under such different locations, viewing angles, and lighting, testing across contexts matters. This category is split into:
- In context: Ads shown in their real out-of-home setting, reflecting the varied environments OOH actually appears in.
- Out of context: The flat creative alone, with the environment excluded. Use this range to isolate creative performance before it's mocked up in a specific placement.


Print ads run in hard copy publications like newspapers, magazines, and mailers. They typically appear in landscape or portrait format and include an image, headline, branding, and body text.
Because print ads usually need to work across several different publications, this benchmark is based on context-independent creative, with the surrounding environment excluded.
TV remains one of the most enduring channels in advertising, offering wide reach, emotional impact, trustworthiness, and a captive audience.
This dataset includes videos from 15 seconds to 2 minutes, in a standard landscape (16:9) format, reflecting typical TV advertising.
Products
Any products
This category includes all packaging assets, along with additional product assets. As Neurons' benchmark categories grow, this will also include product designs and assets depicting products in and out of use.
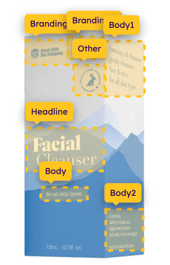
Packaging
This category shows product packaging on a white, transparent, or neutral background. It's only available for images, and the dataset mostly includes individual packaging designs or grouped product packaging.
Websites
Any website
Websites vary enormously in purpose, from news and entertainment to sales and communication. Their components differ too, though sites with the same purpose tend to share similarities, which is why we have specific benchmarks for two of the most common types: brand sites and e-commerce sites.
Use a type-specific benchmark for the most accurate comparison. If your website doesn't fit either category, use this overall category to compare against the average impact across any website type.
All website benchmarks represent landing page views on a standard desktop resolution, without browser navigation or pop-ups.
Brand websites
A brand website's main purpose is effective communication with customers: sharing what the company does and the services it offers. Brand sites also help establish purpose and emotional connection, build credibility, and encourage interaction with both customers and the business.

E-commerce websites
This category covers websites that sell products or services from multiple brands. Because these sites are built around discovery, selection, and purchase, imagery and text around product features carry the most weight.
Hero banners
Only available for images.
Hero banners are the large, full-width visual at the top of a webpage, typically the first thing a visitor sees above the fold. Because layout and available space differ so much by device, this benchmark is split by device:
- Desktop hero banners
- Mobile hero banners

Overall
Any use case
This benchmark shows the average impact across all other use case categories, for both websites and advertising.
We always recommend using the benchmark that matches your asset for the most accurate comparison. Use this overall category only if your creative doesn't fit any specific category, or if you simply want to compare against the impact across any use case.