
Dive into how we created the benchmarks from a dataset of a total 13.689 unique assets and 67.429 AOIs!
Dataset
With Copilot, the Neurons platform now has a multi-layered benchmark system for both images and videos. Benchmarks are based on a total of 13.689 unique assets (7.991 images and 5.698 videos) and 67.429 Areas of Interest (AOIs).
The AOI types are different for images and videos.

Benchmark Data Pool & Collection
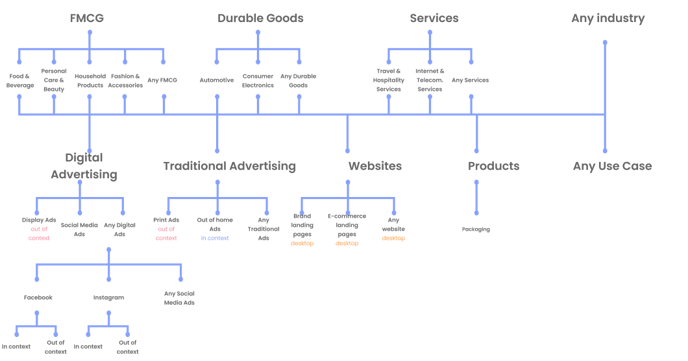
Categorization
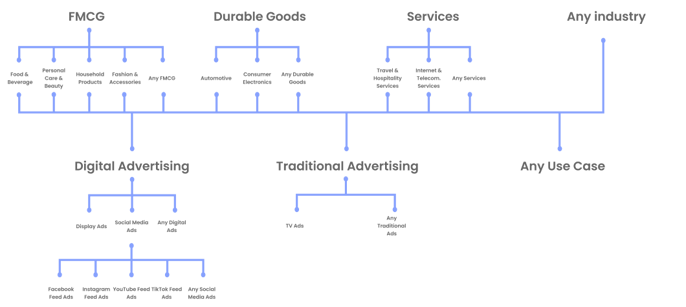
The industry categorization was created on an asset level instead of a brand level.
This approach allows a single brand to fall into multiple categories.
Restaurants are grouped under the Travel & Hospitality Services subcategory, and Fashion & Accessories is included in FMCG. This method ensures we obtain the necessary representative samples. The dataset includes other categories as well.
Assets in Context vs. Out of Context
Some use cases, namely Out of Home and Social Media image ads are in context, meaning that besides the assets itself, the benchmarks also take the surrounding elements into consideration. This approach is used because the context, such as a Facebook or Instagram feed, affects how viewers focus their attention.
Videos are always presented Out of Context because sourcing is not scalable.
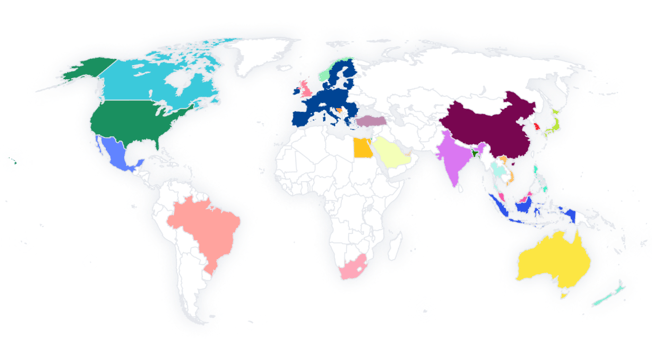
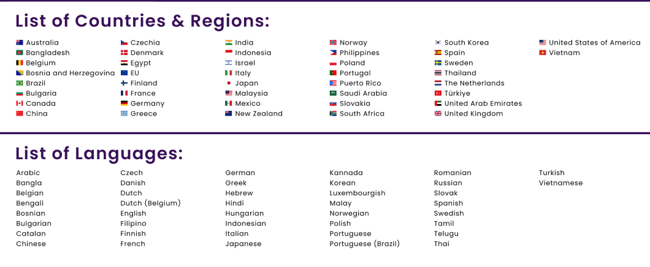
Countries and Regions
New Benchmarks Calculation
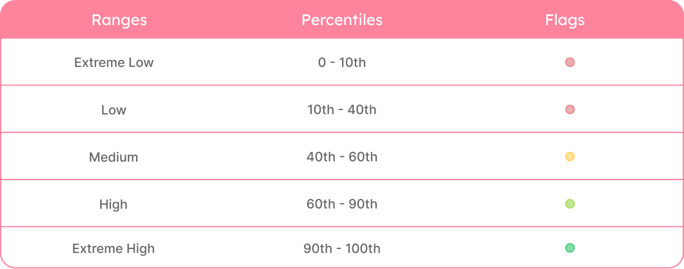
Insights Ranges and Benchmark Methodology
The Insights ranges are at the core of Copilot.
The Insights ranges determine the specific interpretations and recommendations for each prediction.
To calculate these ranges, Copilot analyzes the full distribution of scores for all assets within each subcategory. Instead of using a median score range, we divide the total score range into five categories: Extreme Low, Low, Medium, High, and Extreme High.
Insights ranges are dynamic and vary according to the asset's classification, which includes combinations of industry, use case, and platform, leading to
different score distributions.
The benchmarks displayed on each metric show the recommended range for each metric based on our insights and recommendations. These include the high or extreme high ranges for Clarity, Engagement and Focus and the medium range for Cognitive demand.

New Benchmarks Categories
Image Benchmarks
Video Benchmarks
Behind the Insights
Copilot’s insights are built on 25 years of experience and expertise in neuropsychology, neuroscience, and neuromarketing, drawing significantly from Dr. Thomas Zoëga Ramsøy's work.
This includes his scientific research, books, courses, and particularly his textbook Introduction to Neuromarketing & Consumer Neuroscience (2nd ed. from Oxford University Press), How to Make People Buy (2024), and Leading Transformation (Harvard Business Review), along with his online courses that have reached over 200,000 students.
We constantly update Copilot with the latest works of Dr. Ramsøy and Neurons and curate findings from marketing, consumer psychology, and neuromarketing to offer the most current and effective insights.
Generating the Insights
Copilot creates specific insights for each combination of metrics, AOIs, file types, exposure time frame, scoring categories, and purposes by conducting an analysis in three steps:
Categorizing performance
Based on 5 performance ranges, asset performance is categorized stretching from very poor to excellent. This step determines the subsequent analysis and controls color-coding.
Selecting recommendation type
Based on the above performance category and selected purpose, Copilot selects the type of recommendation to give: maintain performance, reach the benchmark, or improve otherwise.
Generating text
Corresponding interpretations and recommendations are mapped out from a total of +38k unique benchmarks and generated based on the previous categorizations.