What Are Neurons AI Benchmarks?
Neurons AI benchmarks are the recommended ranges for each key metric evaluated by our platform. They indicate what an optimized creative asset should score across metrics like Focus, Engagement, Memory, and more—providing you with an industry-standard measure against which to compare your creative's predicted impact.
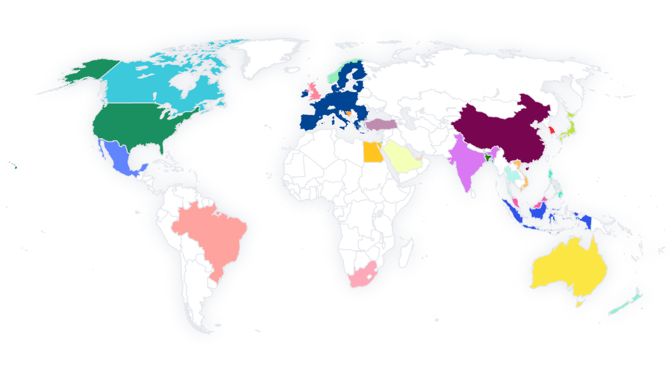
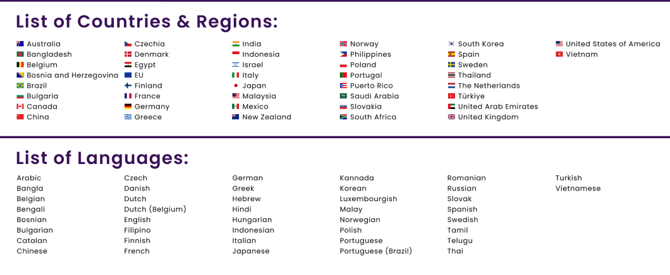
Our benchmarks derive from an ever-growing dataset of more than 10,000 images and over 7,000 videos (with nearly 70,000 distinct Areas of Interest or AOIs), gathered from various regions and across diverse industries and use cases. This extensive dataset ensures that our benchmarks are not only representative but also continuously refined as more data is collected.
The Calculation Process
The process of calculating benchmark ranges is multi-layered and dynamic. Here’s a detailed look at how we determine the asset categorisation and benchmark ranges:
1. Data Collection & Categorization- Asset-Level Analysis: Every creative is categorized not by brand alone but by its visual content and contextual cues. This allows a single brand to appear in multiple benchmark categories if needed.
- Industry and Use Case Segmentation: Creative assets are further divided based on industry (e.g., FMCG, Automotive, Services), and specific use cases (Social Media, Display Ads, Out of Home, etc.).
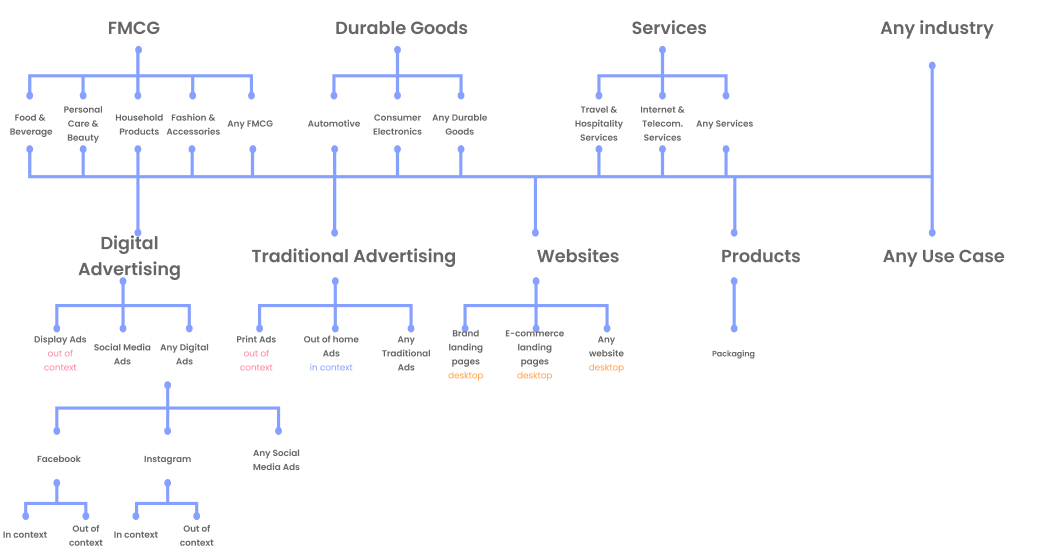
Image benchmark combinations
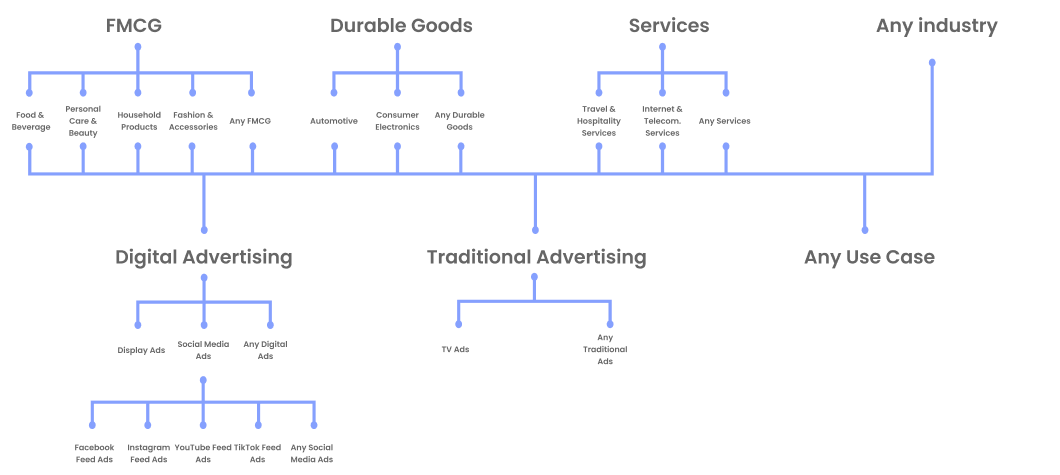
Video benchmark combinations
- AOI Differentiation: For assets where the placement of key elements (like the product, branding, or call-to-action) matters, AOI-specific benchmarks are computed to offer granular insights.
-
- We aggregate all the raw metric scores—for example, Focus, Engagement, Memory, and Attention—from the assets grouped by a given objective and category.
-
- The full distribution of scores is then analyzed to establish the range of impact for each metric.
3. Dividing into Buckets
- Instead of using a simple median or average, the total score range for each metric is segmented into five distinct buckets:
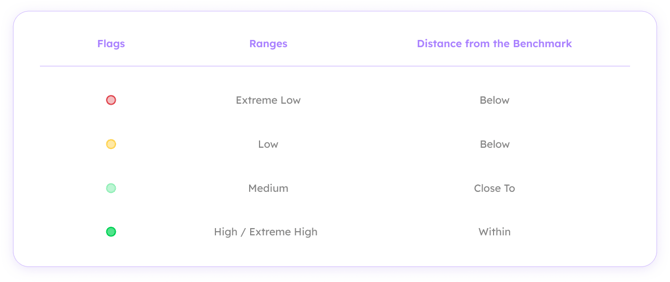
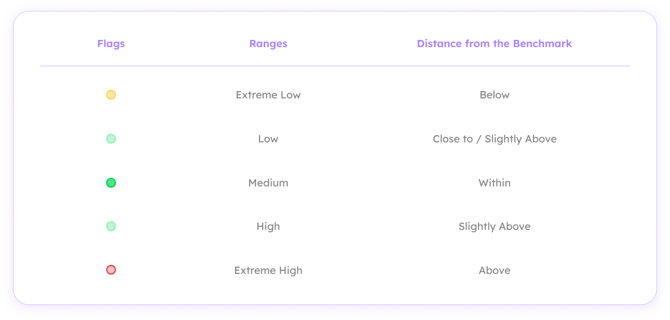
- Cognitive Demand is a non linear score, so its benchmark range is a bit more complicated
- This five-tier system is designed to capture the full spectrum of impact, helping to quickly identify not only where an asset stands, but also how much room there is for improvement.
- The “High” & “Extreme high” are typically set as the target benchmark because it represents the top 20% of high-impact assets in that specific segment.
- Cognitive demand is the only non-linear metric, where the recommended range is set at “medium”.
Image vs. Video Benchmarks
Neurons AI distinguishes between image and video creative assets due to inherent differences in engagement and context:
- Image Benchmarks:
Some creative formats, such as Out of Home or Social Media ads, include “in-context” elements. The benchmarks for these assets account for surrounding visual cues that might affect viewer perception. - Video Benchmarks:
For videos, the focus remains solely on the core creative content (assessed “out-of-context”), ensuring that metrics accurately reflect the asset’s intrinsic strengths without external influence.
Validation and Continuous Refinement
Our benchmark ranges have been validated through rigorous:
- In-market Analyses: The ranges are tested against real-world impact indicators, such as click-through rates, conversion data, and dwell times.
- Decades of Neuromarketing Research: We incorporate behavioral insights and long-term research findings to confirm that our benchmarks reflect the impact of top assets.
This dual validation—from both empirical data and scientific research—reinforces the reliability of our benchmarks. Notably, the benchmark ranges have been shown to align consistently with the top 20% of high-impact assets in each use case.
Bridging Benchmarks and Impact Scores
The calculated benchmark ranges are integral to determining your asset’s Neurons Impact Score. Here’s how they work together:
- Metric Comparison: Your creative’s predicted scores are compared against the benchmark ranges.
- Bucket Assignment: Each metric is placed into an optimal range.
- Adjustment Application: Based on its proximity to the ideal range, each metric score receives an adjustment.
- Aggregation: The adjusted scores are averaged to derive the final NIS, offering a clear, concise measure of creative impact.
For more on how these scores tie into broader insights, check out our detailed article on Understanding the Neurons Impact Score.
Summary Tips
✅ Dynamic and Category-Specific: The benchmarks adjust as our dataset grows, ensuring up-to-date comparisons.
✅ Detailed Breakdown: Every creative is evaluated at both the overall and AOI levels, providing multi-layered insights for optimization.
✅ Informed Creativity: Use these benchmarks to pinpoint which aspects of your creative need refinement for higher impact.
Have questions or need further guidance?
Our support team is available at support@neuronsinc.com to help you navigate and optimize your asset impact.