![305073553_499374155352633_936760715116756730_n.png]](https://knowledge.neuronsinc.com/hs-fs/hubfs/305073553_499374155352633_936760715116756730_n.png?height=24&name=305073553_499374155352633_936760715116756730_n.png)
What is the Neurons Impact Score?
The Neurons Impact Score is a new, simplified way to understand the impact of a creative asset (like an ad image or video), based on key neuroscience-backed metrics. Whether your goal is brand building or conversion, the Neurons Impact Score gives you a single, easy-to-understand score from 1 to 10 that shows how strong your creative is in capturing attention, engaging viewers emotionally, and being memorable.
What do the scores mean?
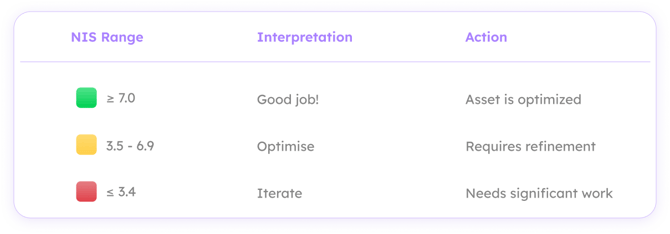
The Neurons impact score is your asset’s "pre-flight check." A score of 7 or above means your asset is optimized and a low score is an opportunity to optimize your creative before spending your media budget.
See the quick onboarding video showcasing the Neurons Impact Score and our new features:
Why it matters:
Many users found it difficult to interpret dozens of separate neuromarketing metrics. The Neurons Impact Score cuts through the complexity and gives you one clear number that supports fast, informed decisions - no neuroscience degree required.
Why Should I Trust the Score?
The Neurons Impact Score is grounded in a dual approach that combines:
- 🧠 Neuroscience expertise - backed by theory on how attention, emotion, memory, and cognitive effort shape consumer behavior.
- 📊 Real-world impact data - from thousands of creatives across platforms and brands, linking Neurons AI metrics to outcomes like brand lift, and ad recall.
This means the Neurons Impact Score doesn’t just reflect theory - it reflects what actually drives marketing success.
How Metrics Are Prioritized?
Each Neurons Impact Score is built on a selection of prioritized metrics tailored to the full combination of your creative's objectives: purpose, industry, use case, and platform. These metrics were selected because they consistently align with success in real-world campaigns.
The prioritization works in two layers:
- Base layer: Metrics are first selected based on your creative type (image, video, or mixed media) and purpose (brand building or conversion).
- Specialized layer: Additional objective-based rules then add or remove specific metrics depending on your industry, use case, and platform - so a LinkedIn social image, a mobile hero banner, and an out-of-home billboard each get a scoring set tailored to what actually matters for that context.
Examples of how specialized rules work in practice:
- On Meta platforms (Facebook/Instagram): The Call-to-Action AOI is removed from the prioritized set, because Meta's own UI provides the CTA button.
- For out-of-home and social image ads: Start metrics replace total metrics, because these ads are typically viewed for under 2 seconds.
- For social video conversion: Start and end metrics are elevated, because the beginning and final moments of a video are decisive for driving action.
How Is the Score Calculated?
The Neurons Impact Score is an average of individual impact scores from each prioritized metric. Here’s how each impact score is calculated:
🧮 Step-by-Step:
- Measure the raw result from the asset (e.g., Focus = 55).
- Compare to a benchmark range specific to the goal and category.
- Place it in a scoring bucket (e.g., Low, Medium, High).
- Apply a bonus or penalty depending on how close it is to the ideal range.
- Convert to a 1–10 score for that metric.
For example, if Focus is far below the benchmark for brand ads in food & beverage, it might land in the Medium bucket with a small penalty, resulting in a score of 5.8 out of 10.
Final Neurons Impact Score:
The final Neurons Impact Score is the average of all available metric impact scores. If a certain metric (like Attention on Product) isn’t applicable, it’s simply skipped - so your score isn’t unfairly penalized.
New Benchmark Categories
The following benchmark categories have been added with the latest update:
- Social Media (LinkedIn): Images and videos on LinkedIn
- Hero Banners: Images on mobile and desktop
- Out of Home - Out of Context: Images only
- CTV: Mixed media only
Updated Scores
We are always updating and improving the Neurons Impact Score - whether that means expanding our benchmark library, refining our underlying models, or adding new objective-based rules. This means that from time to time, an existing creative's score may no longer reflect the latest calculation logic.
When this happens, your creative will display an Update tag. This is not a problem - it simply means a more accurate score is available.
💡 Tip: See our step-by-step guide: How to Recalculate an Updated Neurons Impact Score →
Filtering by Neurons Impact Score
In the folder view, you can filter creatives by their Neurons Impact Score status:
- Optimize: Score below threshold - creative needs work
- Good Job: Score at or above 7 - creative is performing well
- Update: creative has an outdated score
- Iterate: creative has been scored, improvements suggested
- Rerun: creative needs to be re-uploaded or reprocessed
How This Helps You as a Marketer or Insight Manager
The Neurons Impact Score is designed to save you time and guide your decisions, especially if you're not a neuroscience expert. Here’s how:
- ✅ Instant clarity – One number tells you where your asset stands.
- ✅ Simplified prioritization – Know which parts of your creative need attention.
- ✅ Faster iteration – No more metric juggling or guesswork.
- ✅ Accessible insights – Even first-time users can understand asset impact at a glance.
With the Neurons Impact Score, you can feel confident making creative decisions - whether you're tweaking a social ad or launching a global campaign.
🧠 Tip: Use the Overview page to see your Neurons Impact Score, key insights, and recommendations - all in one place.
Still have questions? Explore more articles or contact our support team for help at support@neuronsinc.com